How to use Prometheus for web application monitoring

Introduction
The ability to comprehend and assess a system's state using the data it produces is known as observability. It is one of the most important traits of system reliability that gives an opportunity to take action. Observability is crucial, especially in distributed systems where end-to-end testing is really difficult or even impossible. There are three pillars of observability:
logging (record events: what + when)
metrics (provide a state of a system using numeric values)
tracing (follow operations that traverse through different systems/services)
In this post, I would like to cover only the metrics part and show how we can implement web application monitoring using Prometheus. We discuss how to choose some metrics as Service Level Indicators (SLIs) and also how to ensure system reliability by setting proper targets as System Level Objectives (SLOs).
About Prometheus
The aim of Prometheus is quite simple: to have a metrics server that gathers data from several systems or applications and aggregates them in one place. Prometheus collects metrics by scraping targets that expose metrics using HTTP endpoints.
The Prometheus server consists of three components:
HTTP server - accepts queries for metrics
Time-series database (TSDB) - store for metrics
Retrieval - data scraping worker responsible for retrieving metrics from sources that expose metrics
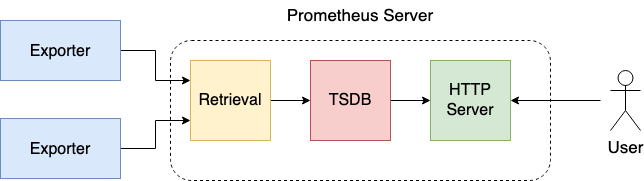
Exporters are processes that run on Prometheus targets responsible for serving metrics and presenting them in an easily consumable format for Prometheus. Prometheus fetches the data from exporters in a pull-based manner (there is also pushgateway approach, but we would not cover it here). There are a lot of native exporters that can be used, e.g. Node exporter (Linux Server), MySQL exporter, etc. Each service that exposes an HTTP endpoint with properly formatted metric data can be an exporter.
Prometheus is using PromQL language for defining queries for metrics. Each metric has the following structure:
metric_name{label1=<label1>, ..., labelN=<labelN>} metric_value
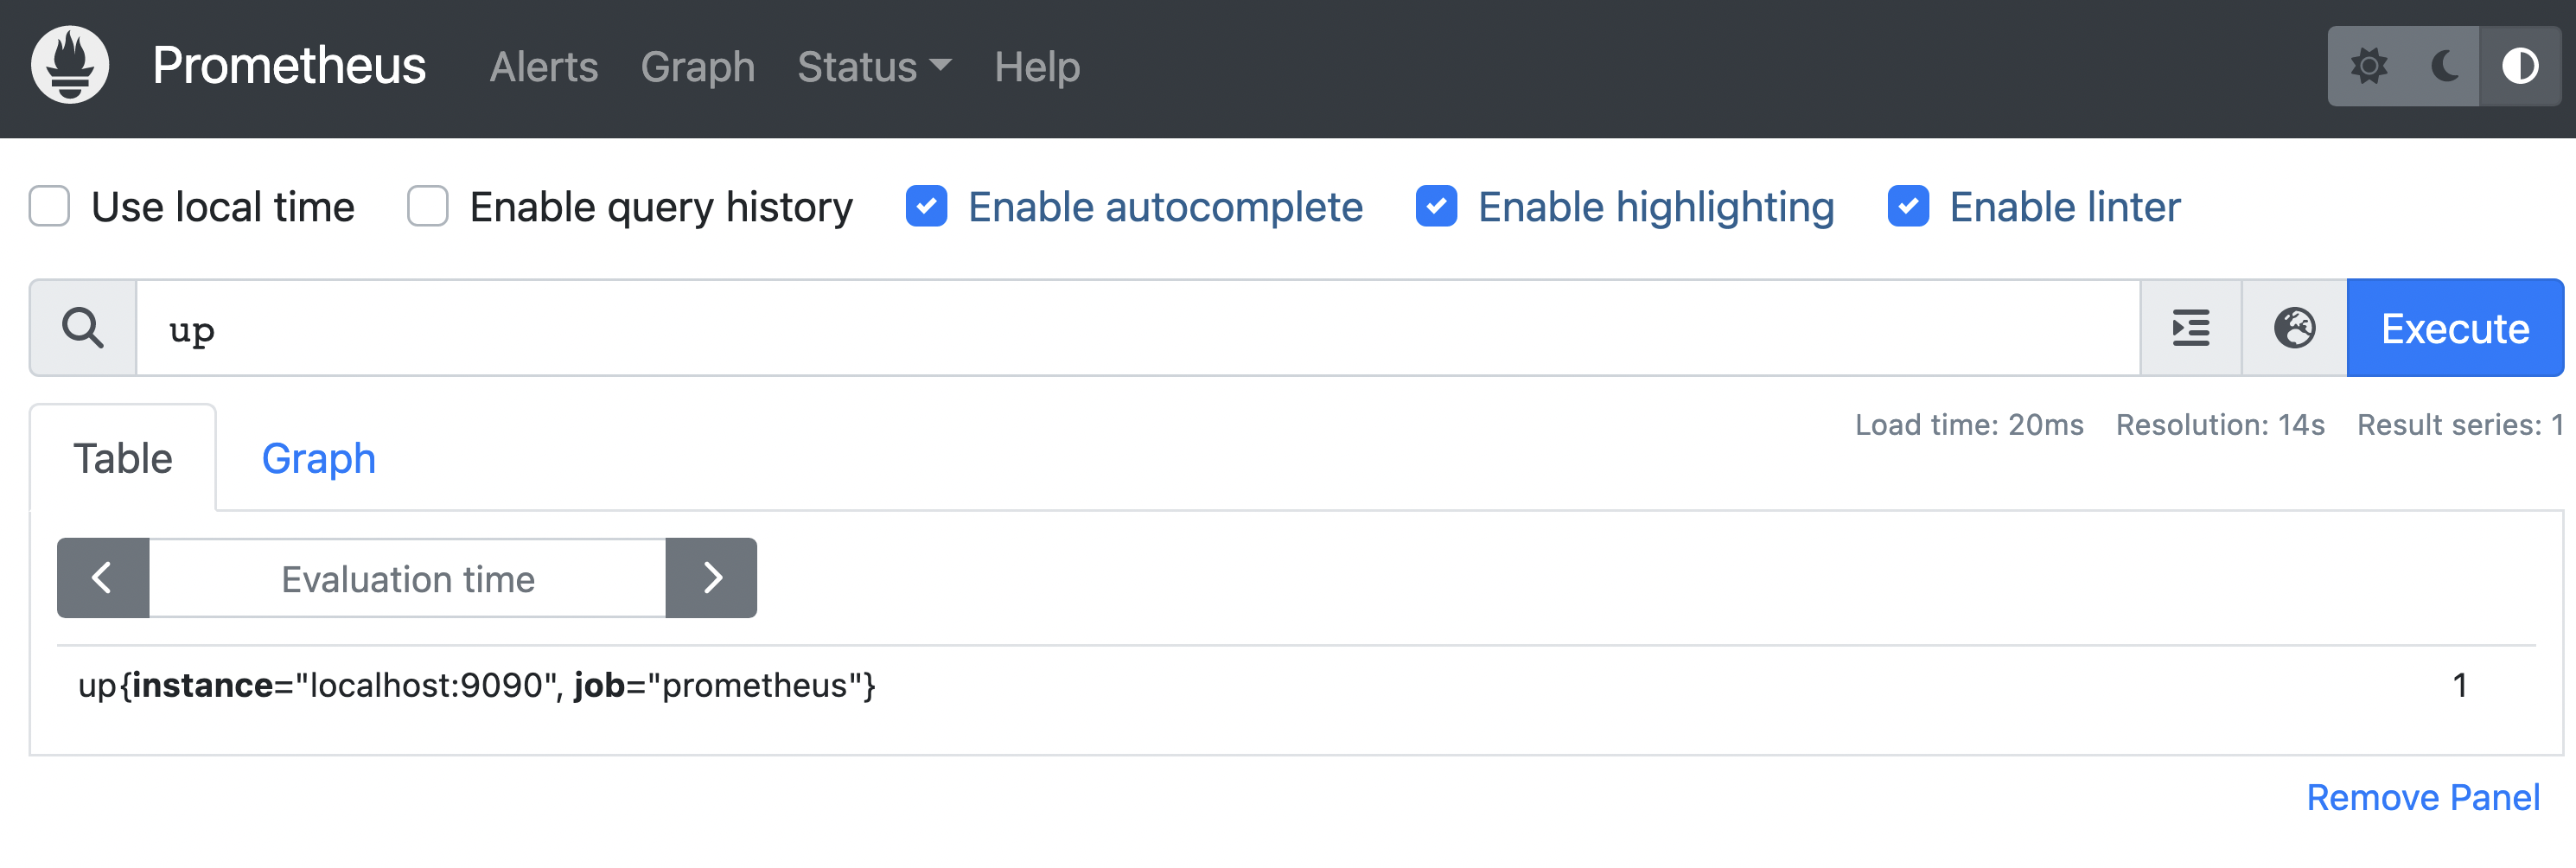
For example:
up{instance="localhost:9090", job="prometheus"} 1
We can define a set of labels for a metric that can be used for filtering. However, each metric has two labels provided by default: instance and job. When Prometheus scrapes a target it also registers the timestamp (UNIX timestamp) when the metric was scraped. So in the database, we have stored the time series of metric values. Prometheus defines four different types of metrics:
Counter - how many X occurs (can only increase), e.g total number of requests
Gauge - what is the current value of X (can change over time), e.g. number of active requests
Histogram - group observations in discrete buckets, e.g. request responses time below 1s
Summary - similar to the Histogram and tell how many percent of observations are below the given value
Prometheus server setup
Prometheus server has to be run, in order to start gathering data needed in system monitoring. To deploy it, we utilize a simple docker-compose file (using the latest prom/prometheus image and exposing 9090 port to get access to the Prometheus User Interface).
# docker-compose.yml
version: "3.7"

services:
  prometheus:
    image: prom/prometheus
    ports:
      - target: 9090
        published: 9090
    volumes:
      - type: bind
        source: ./prometheus.yml
        target: /etc/prometheus/prometheus.yml
To make it works, we must also provide a Prometheus configuration file prometheus.yml that would be bound to /etc/prometheus/prometheus.yml inside running Prometheus container.
# prometheus.yml
global:
  scrape_interval: 15s
scrape_configs:
  - job_name: "prometheus"
    scrape_interval: 5s
    static_configs:
      - targets: ["localhost:9090"]
The scrape_configs section defines a list of targets for metrics pulling. In the beginning, the only source of metrics will be our running Prometheus server. So the Prometheus server would be scraping itself.
Now we can run our docker-compose file and test how it is working:
$ docker-compose up
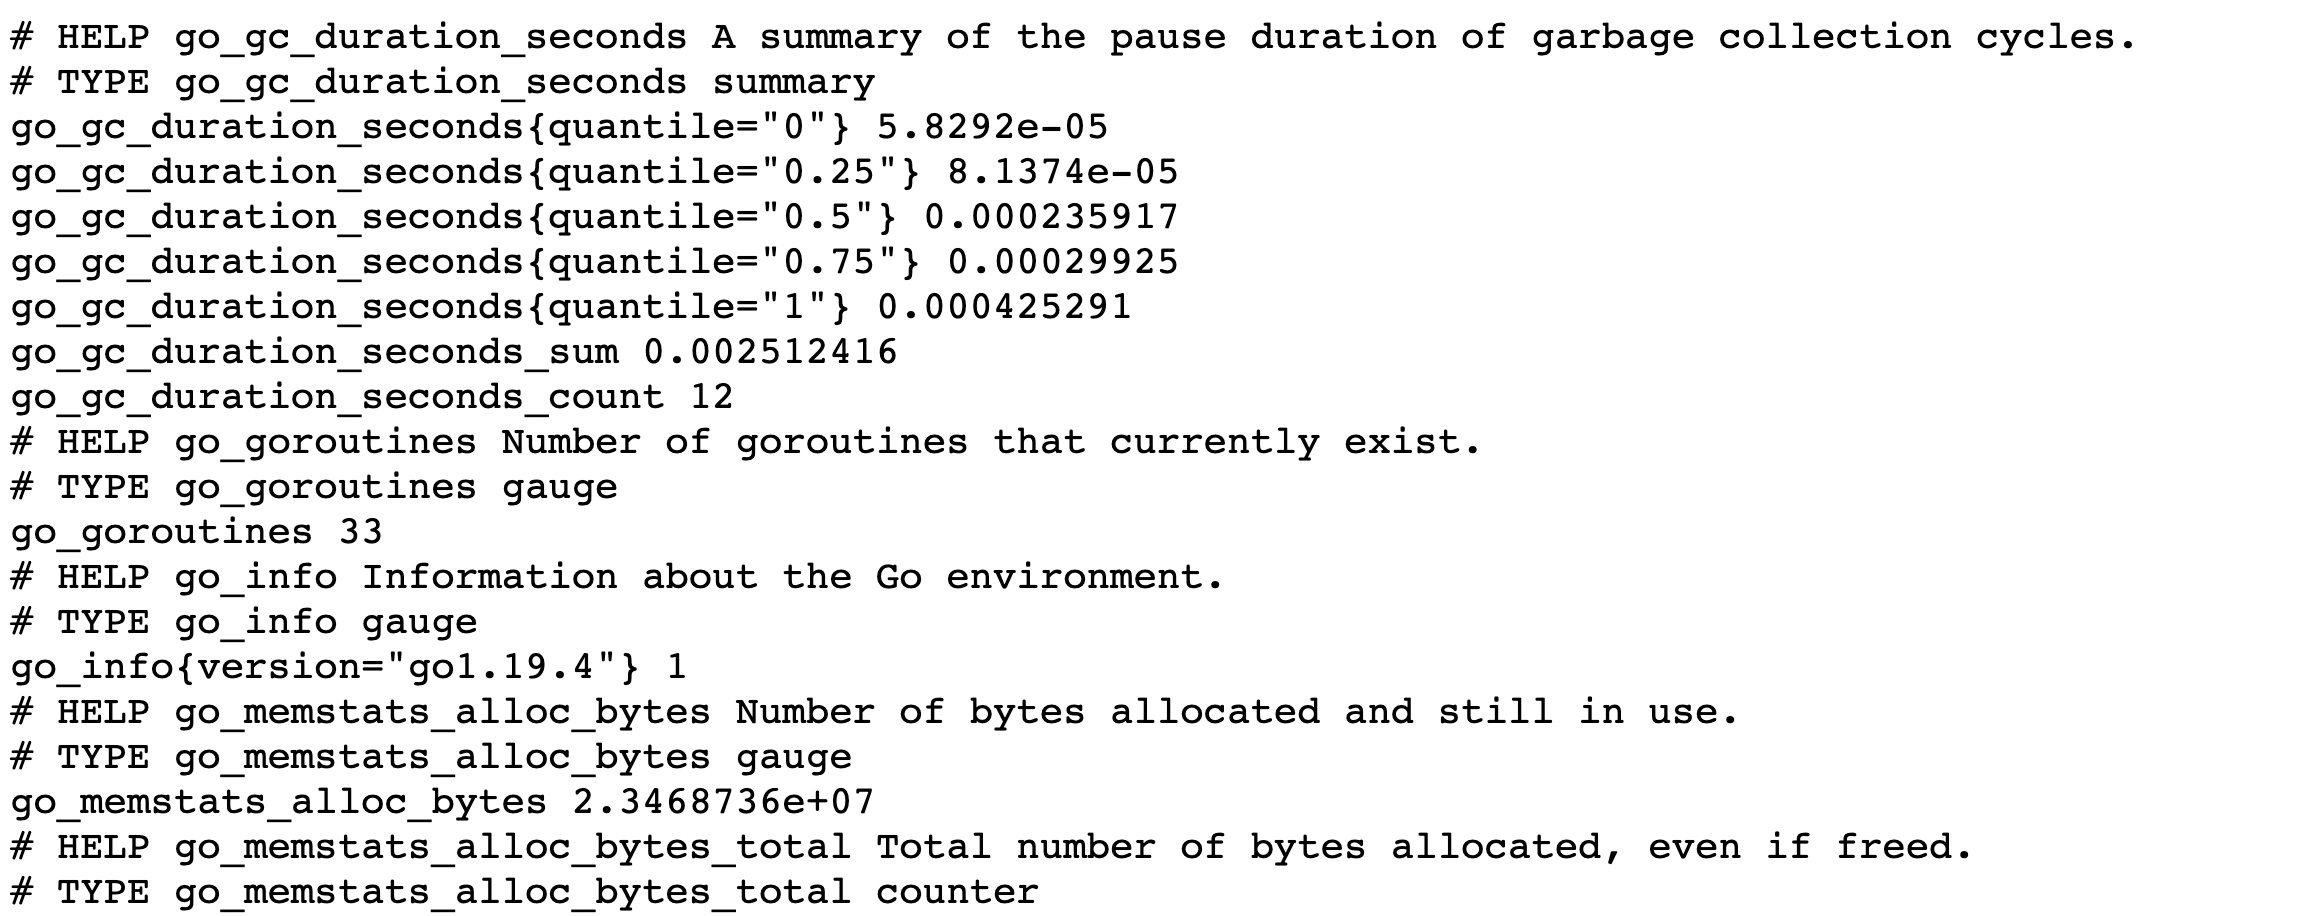
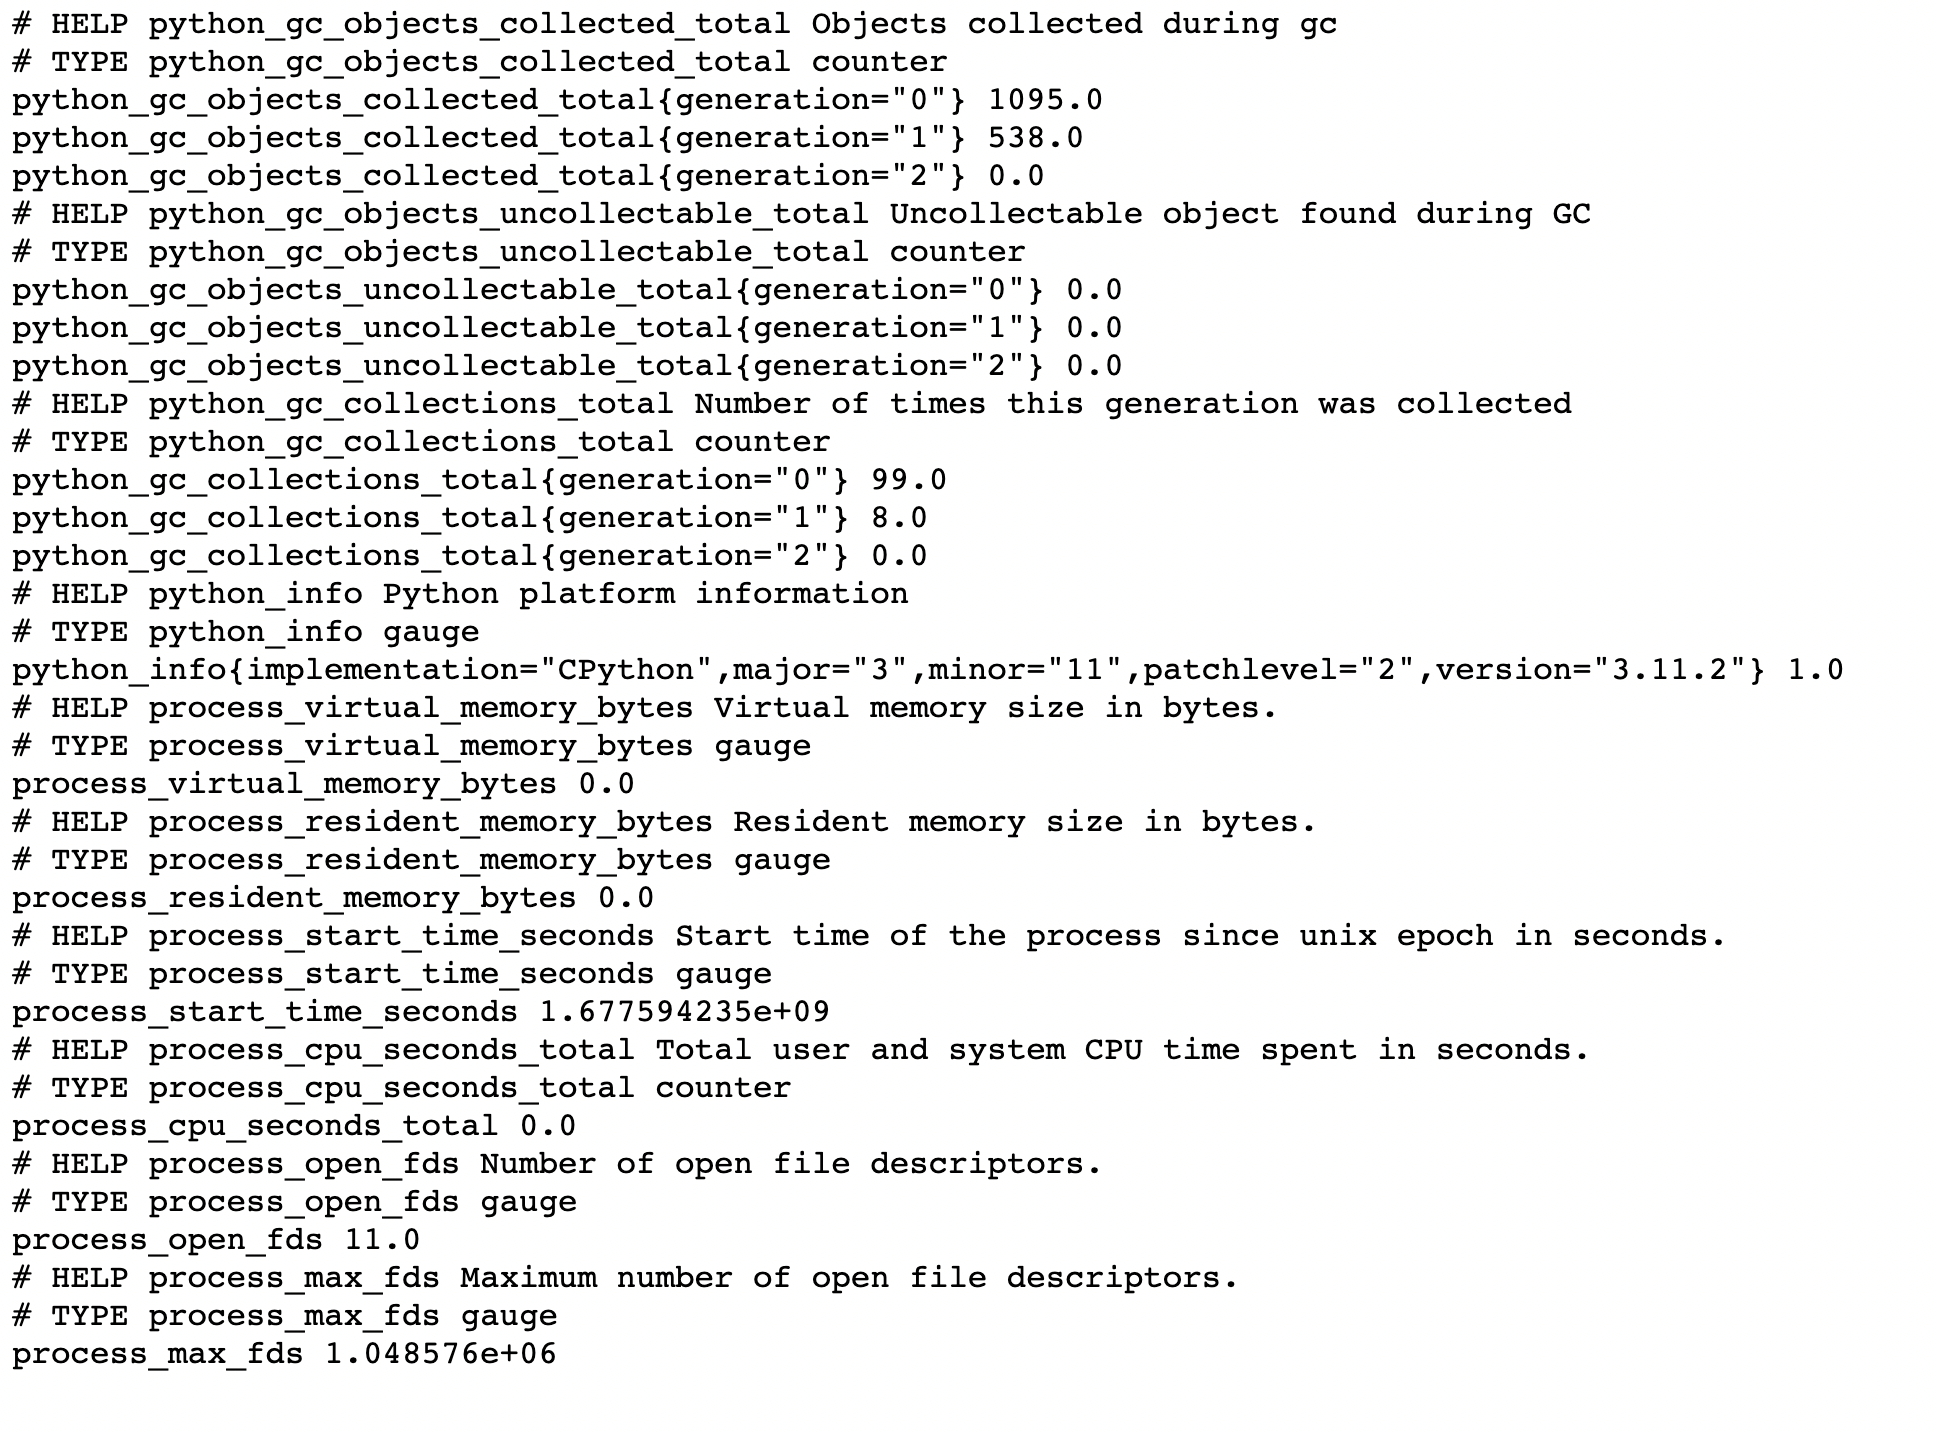
As a metrics exporter, the Prometheus server exposes data at the default /metrics endpoint. Here (at http://localhost:9090/metrics), we have a piece of how Prometheus server metrics look alike:
By hitting http://localhost:9090 , we can access the Prometheus UI and check whether our configuration is working properly.
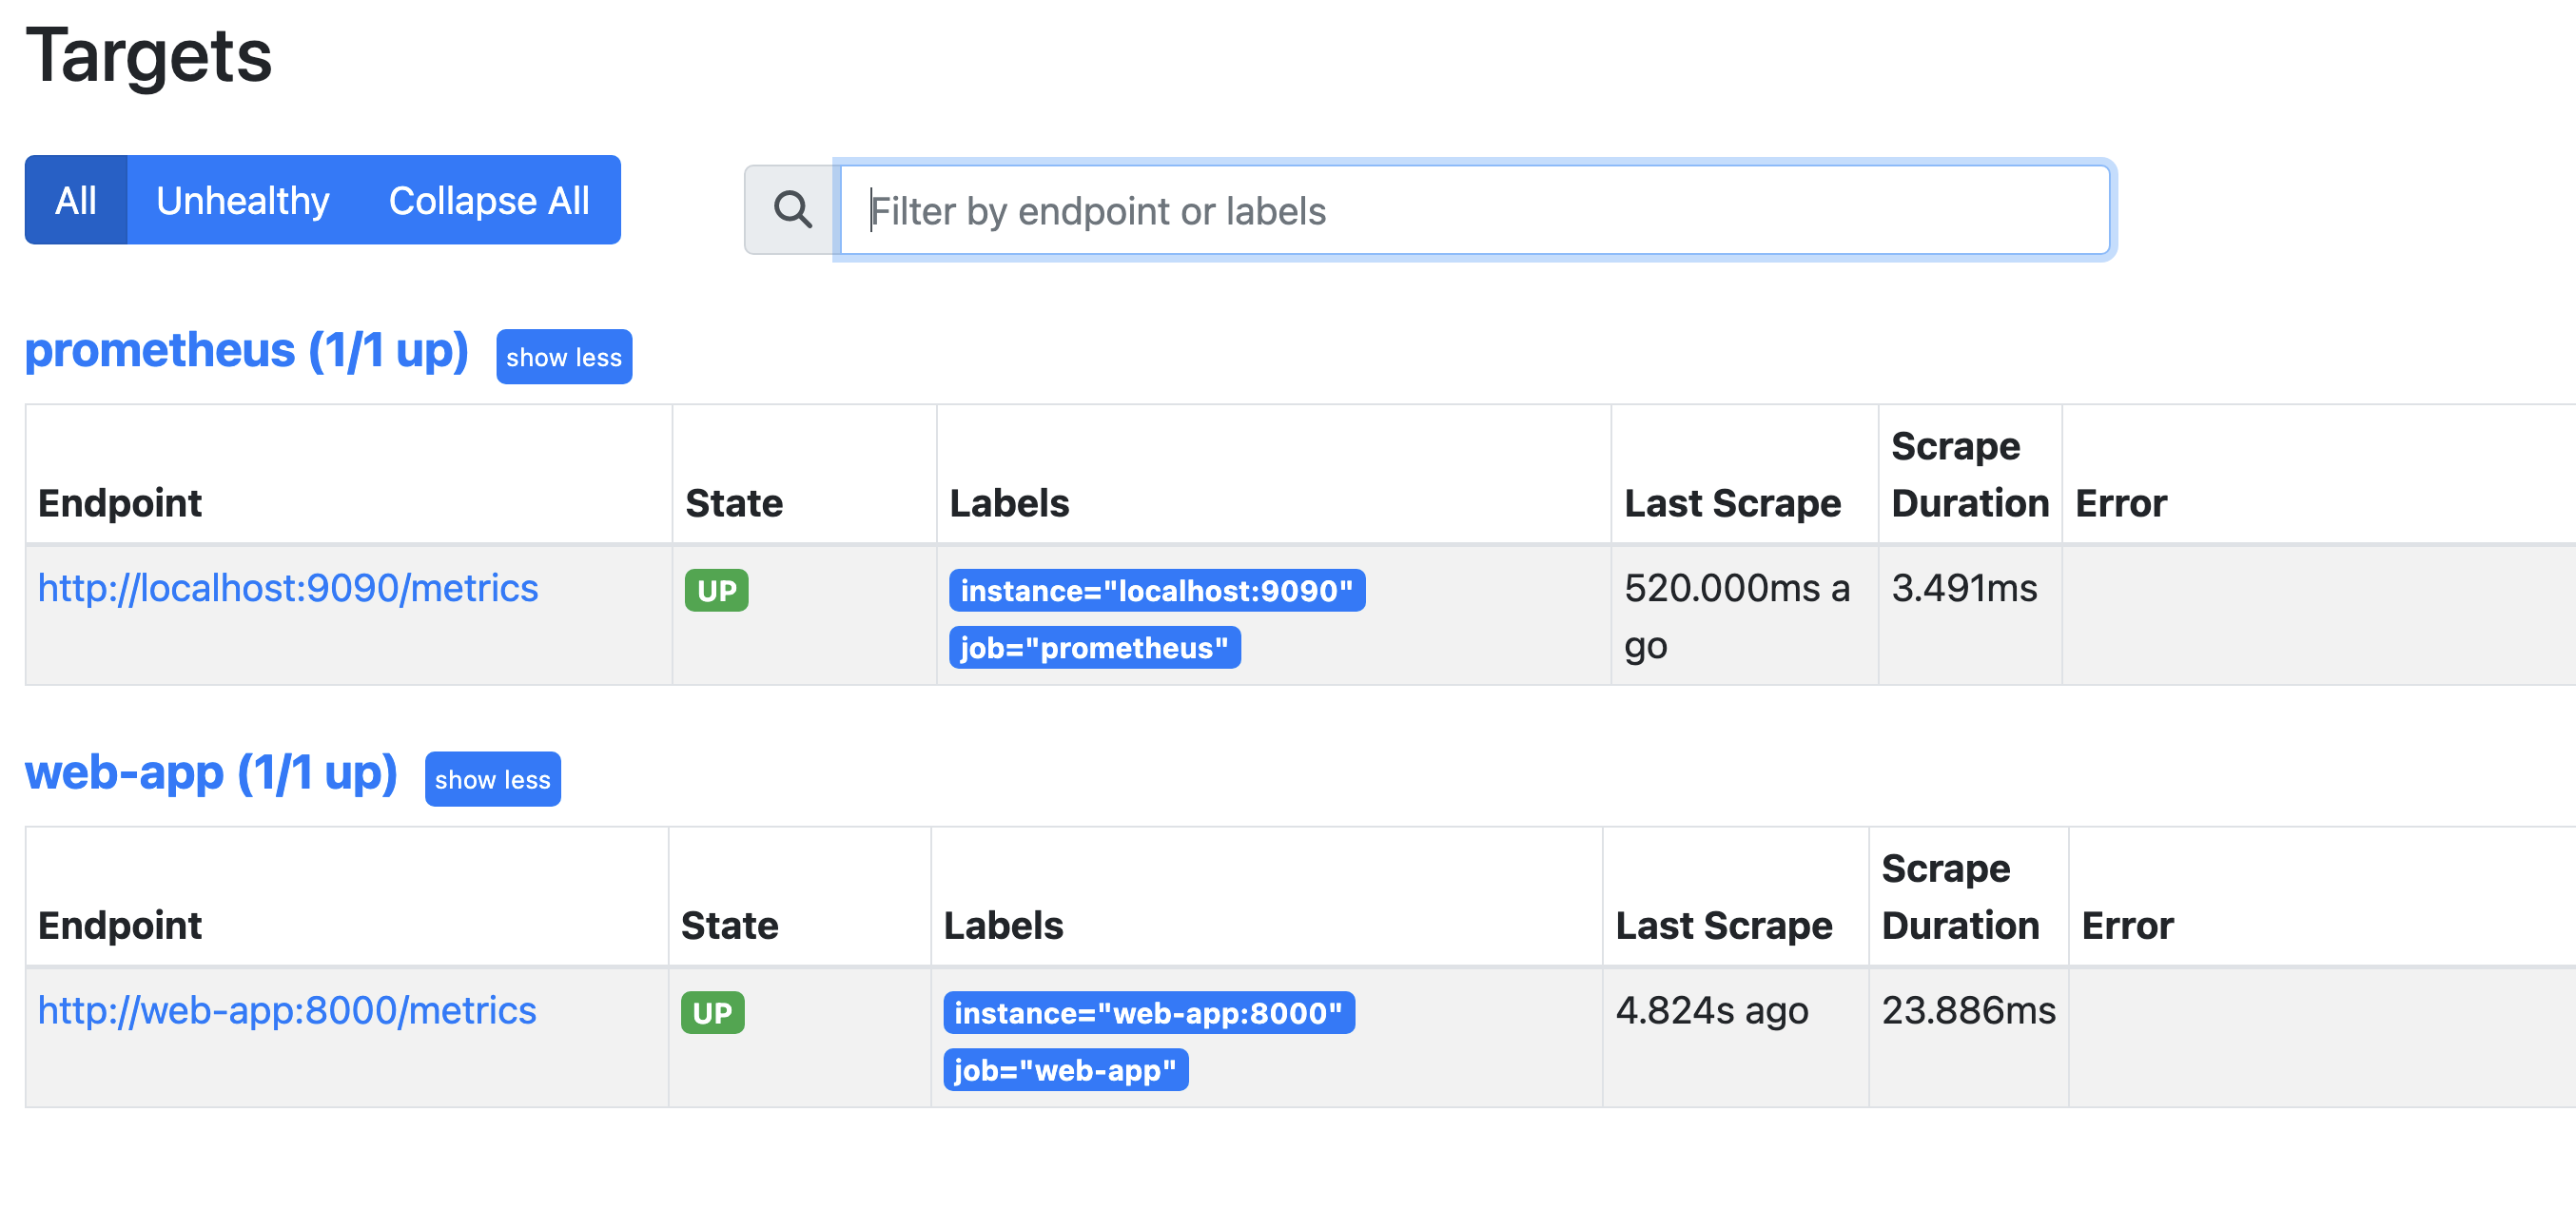
There is only one metrics target that is up and running - and it is the Prometheus server.
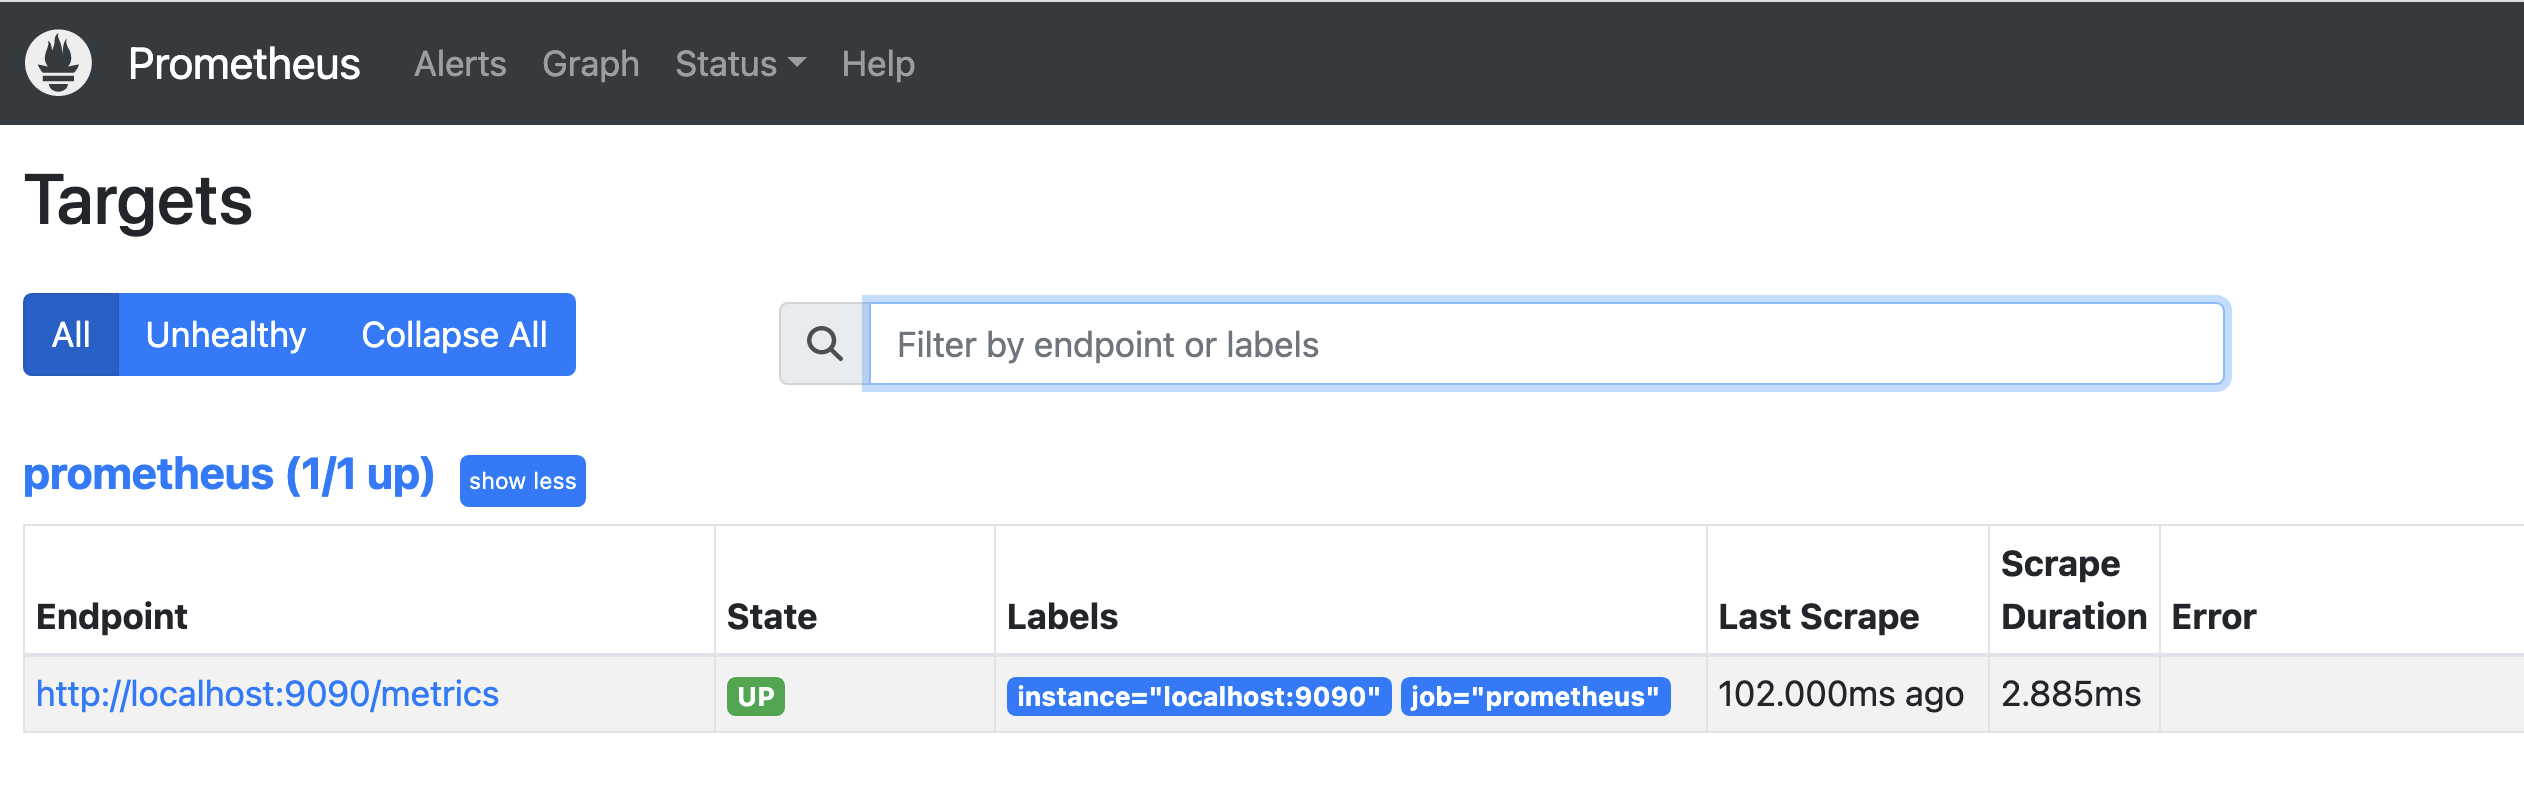
The next step will be adding our web application as a new metrics exporter.
Web application exporter
Our new exporter will be a simple web application built in the Python Flask framework. For Prometheus integration, we take the prometheus_client library.
# app.py
from flask import Flask
from prometheus_client import make_wsgi_app
from werkzeug.middleware.dispatcher import DispatcherMiddleware

app = Flask(__name__)
app.wsgi_app = DispatcherMiddleware(
    app.wsgi_app, {"/metrics": make_wsgi_app()}
)

@app.route("/")
@app.route("/up")
def up():
    return "I am running!"
Here are the packages that will be used by the application:
# requirements.txt
Flask==2.2.3
prometheus-client==0.16.0
We have a simple HTTP /up endpoint and also /metrics endpoint provided by the library. The next step will be defining Dockerfile:
FROM python:alpine
COPY app.py requirements.txt /
RUN pip install -r requirements.txt
EXPOSE 8000
CMD ["flask", "run", "-h", "0.0.0.0", "-p", "8000"]
and building a container image:
$ docker build -t web-application-monitoring:v0 .
To integrate it with the Prometheus server, we have to do two things:
- add a new scrape target in
prometheus.ymlconfig file
# prometheus.yml
global:
  scrape_interval: 15s
scrape_configs:
  - job_name: "prometheus"
    scrape_interval: 5s
    static_configs:
      - targets: ["localhost:9090"]
  - job_name: "web-app"
    scrape_interval: 5s
    static_configs:
      - targets: ["web-app:8000"]
- add our application docker image to the docker-compose file:
# docker-compose.yml
version: "3.7"

services:
  prometheus:
    image: prom/prometheus
    ports:
      - target: 9090
        published: 9090
    volumes:
      - type: bind
        source: ./prometheus.yml
        target: /etc/prometheus/prometheus.yml
  web-app:
    image: web-app-monitoring:v0
    ports:
      - target: 8000
        published: 8080
The application will be exposed to the external world on port 8080, so we can test that everything is working by hitting http://localhost:8080. We have also some metrics exposed (at http://localhost:8080/metrics ) by default (provided by promethus_client library):
Our Prometheus server have also a new target running and accessible for scraping:
HTTP traffic metrics
We have some metrics provided for our exporter by prometheus_client. But these metrics are not tell anything about our web HTTP endpoints. For better readability we disable it for now:
# app.py

import prometheus_client

prometheus_client.REGISTRY.unregister(prometheus_client.GC_COLLECTOR)
prometheus_client.REGISTRY.unregister(prometheus_client.PLATFORM_COLLECTOR)
prometheus_client.REGISTRY.unregister(prometheus_client.PROCESS_COLLECTOR)
As far as HTTP traffic is concerned, we are mostly interested in the following data:
how many requests it is handling
how many errors occur
what is requests latency
For the purpose of this article, I would like to introduce a kind of synthetic endpoint that would return different HTTP responses and durations to produce some data for metrics gathering (It is of course redundant and unnecessary in a working system).
# app.py

import random
from time import sleep

@app.route("/synthetic")
def synthetic():
    random_duration = random.randint(1, 50) * 0.001
    sleep(random_duration)
    response_code = random.choice([200, 200, 200, 200, 200, 400, 401, 500])
    return Response(str(response_code), status=response_code)
The next step will be preparing some code that monitors our endpoint:
from prometheus_client import Histogram

HTTP_REQUEST_DURATION = Histogram(
    "http_request_duration",
    "Requests durations",
    ["method", "url", "code"],
    buckets=[0.01, 0.1, 0.5, 2, float("inf")],
)

def observe_http(func):
    def wrapper(*args, **kwargs):
        start = time.time()
        response = func(*args, **kwargs)
        end = time.time()
        HTTP_REQUEST_DURATION.labels(
            method=request.method,
            code=response.status_code,
            url=request.url,
        ).observe(end - start)
        return response
    return wrapper

@app.route("/synthetic")
@observe_http
def synthetic():
    ...
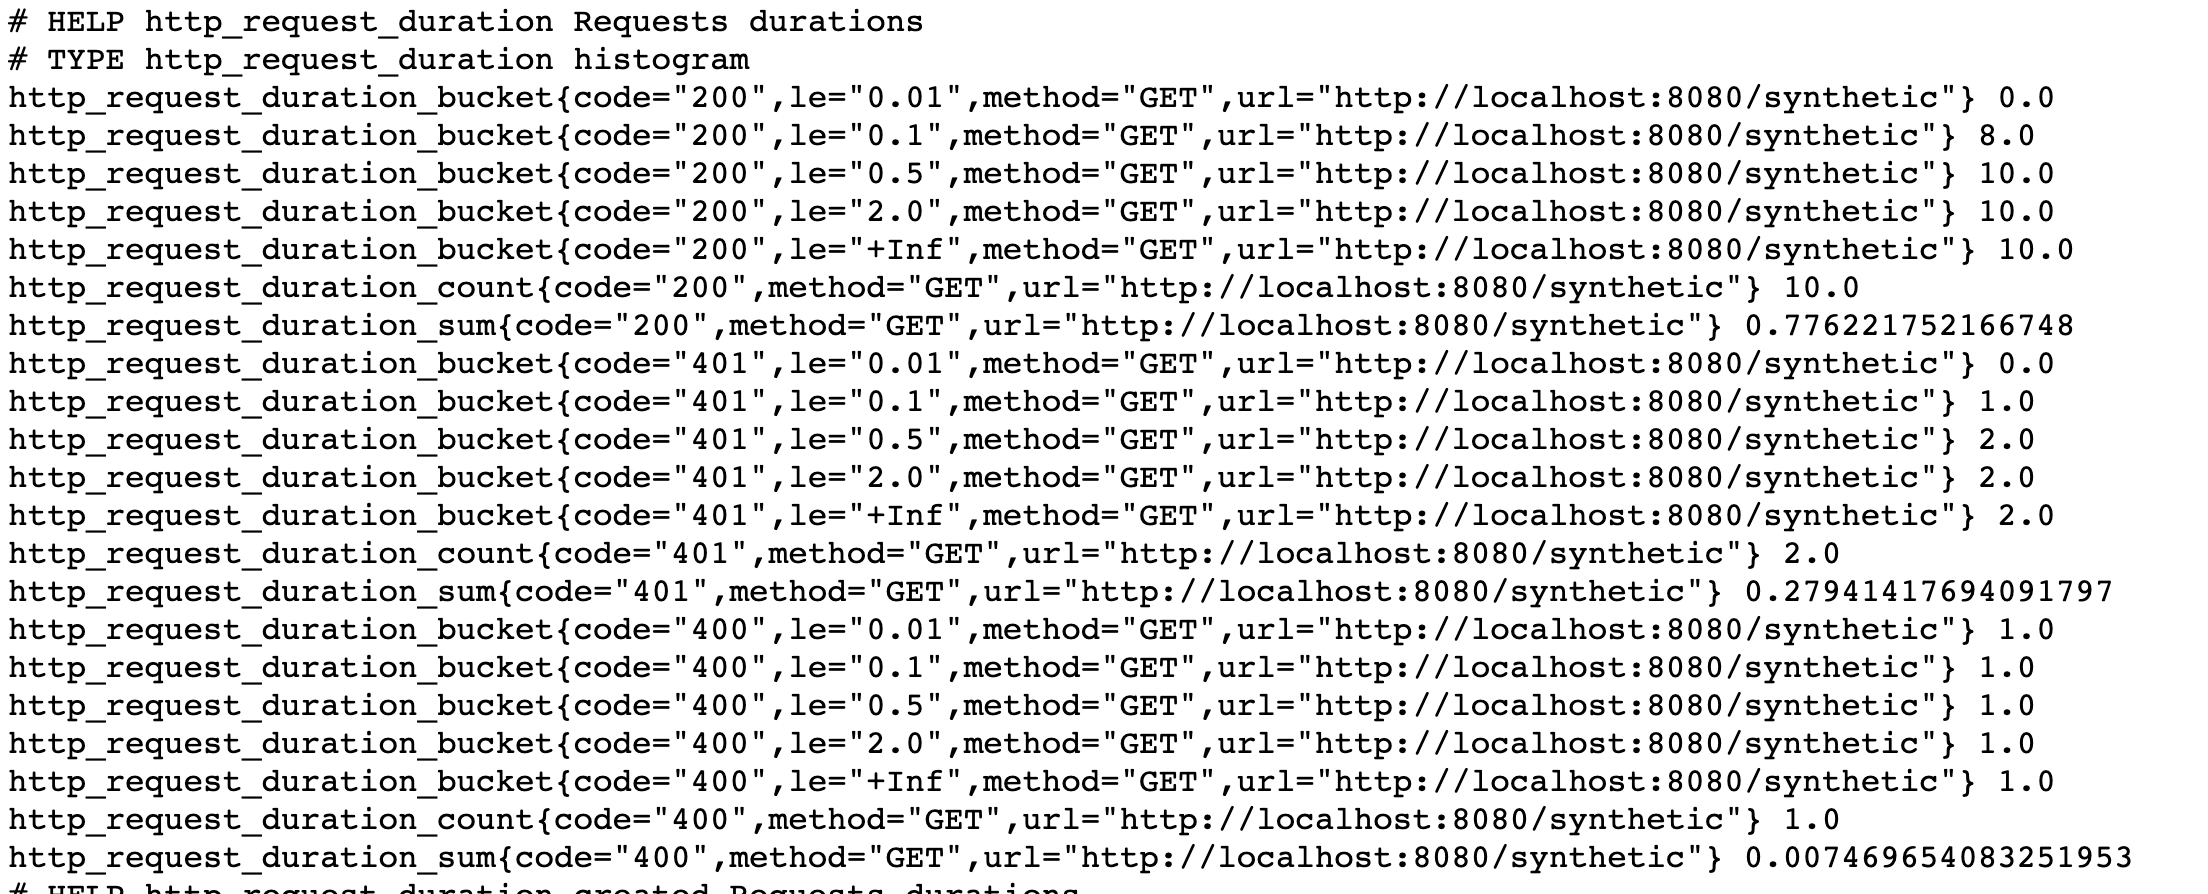
The HTTP /synthetic endpoint is decorated by observe_http function that collects HTTP_REQUEST_DURATION metric. For our histogram we declared:
three labels:
method,code,url(that metric can be grouped by)five buckets:
less than 10ms
less than 100ms
less than 500ms
less than 2s
less than infinity
The above histogram provides us with a metric for each bucket with _bucket suffix but also _count and _sum metrics.
Service Level Indicator
When designing a solution it is important to specify measurable targets/goals of the working system. These targets can help to determine the level of reliability of the system (e.g. by users).
Service Level Indicator (SLI) is a quantitative measure of some aspects of the level of service that is provided, e.g. number of errors, latency, availability, etc. The RED (Rate, Errors, Duration) method is one of the widely known techniques that can serve as a source of SLIs. It consists of:
- Rate - number of requests per second
sum(rate(http_request_duration_count{job="web-app"}[1m]))
- Errors - the number of those requests that are failing
sum(rate(http_request_duration_count{job="web-app",
status_code=~”5..”}[1m]))
- Duration - the amount of time those requests take
histogram_quantile(0.99, sum(rate(http_request_duration_bucket
{job="web-app"}[1m])) by (le))
If you want to get more understanding of this approach, I would highly recommend Tom Wilkie talk about how to instrument services.
While the RED method can function as an SLI, it is usually recommended (see Google SRE book) to take SLI as the ratio of two numbers: the number of good events (e.g. with a response code different from 5xx) divided by the total number of events. Thanks to it our indicator is always between 0 and 1, and we can easily set a target for our system - Service Level Objective (SLO), e.g 98% requests without errors. It enables us to trigger alerts when our system reaches a level that is below our SLO. The value for SLOs must be carefully chosen to avoid excessive alert calls but guarantee that system is stable at a promised level.
Conclusion
The article has covered the Prometheus server setup, web application exporter, and HTTP traffic metrics. Additionally, the article has introduced the Service Level Indicator (SLI) and Service Level Objective (SLO) concepts, which can help determine the level of reliability of a system.
Although this post covers some aspects of system monitoring based on metrics, there is a lot more that should be done to have an application production ready. Prometheus is a really good tool for metrics gathering. However, it may not best choice for visualization and alerting. For that need, we should probably turn to Grafana and Alertmanager.
All stuff covering Prometheus setup and web application code can be found in the GitHub repo. If you want to dive deeper into Prometheus I strongly recommend this course.
I hope it would be helpful.


