Centralized logs with Grafana Loki

Overview
Logging is a foundational component of observability (along with metrics and tracing), offering a detailed narrative of activities within a system. It involves capturing and storing records of events or messages generated by a system during its operation. These logs serve as a detailed chronicle of what has happened within the system, containing valuable information about errors, warnings, user interactions, and other relevant activities.
The 12-factor app methodology suggests a centralized logging approach - keeping logs in a centralized location using a standardized logs format. This aggregation gives a holistic view of the system's health and behavior. When issues arise, centralized logs make troubleshooting and debugging problems easier. Instead of checking individual logs on each instance or component, developers, and administrators can examine a centralized repository, making it more efficient to identify and resolve issues. As applications scale, managing logs becomes more challenging. Centralized logging systems are designed to scale with the growth of the application, ensuring that log data can be efficiently stored and accessed, even in large-scale, distributed environments.
In this post, we discuss the centralized logging system architecture and show how to set up a logging server (Grafana Loki) and configure applications to push logs into it.
Architecture
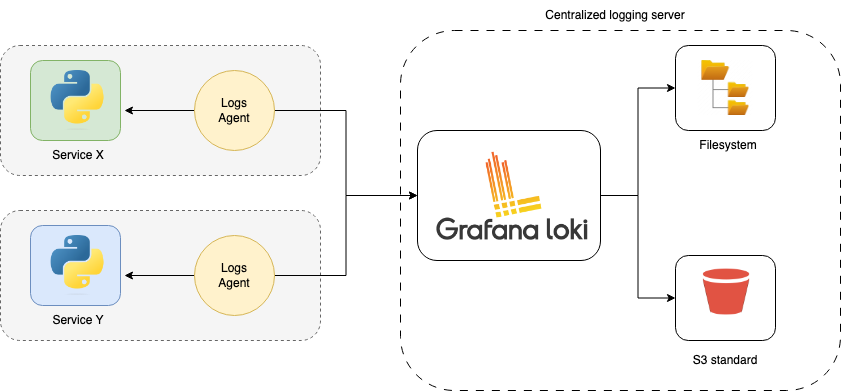
Centralized logging architecture involves using agents or clients, such as Promtail, Fluentd, Logstash, or others, installed on the application side to facilitate the transmission of logs to a centralized log aggregation system, such as Grafana Loki. These agents are crucial in gathering logs from the local server or application instances and streaming them to the Grafana Loki instance. One notable agent is Promtail, specifically designed for use with Loki, making it a popular choice for users of the Grafana ecosystem. Once configured, the agent continuously monitors log files, extracts relevant information, and forwards log entries to the Loki instance.
In terms of storage options within the Loki instance, there are several choices available. The simplest option involves using the local filesystem of the Loki instance to store log data. This approach is suitable for smaller deployments or scenarios where storage requirements are modest. However, for larger-scale applications and to ensure durability and scalability, users can opt for external storage solutions like Amazon S3. By leveraging S3 as an external storage backend, users can benefit from the reliability and scalability of S3, offloading the responsibility of managing a dedicated database system for log storage.
Grafana Loki configuration
We will create a simple Docker Compose file to present how to gather logs from different sources and aggregate them for querying in the Grafana Loki service.
The Loki instance is configured in the YAML file. Here (loki-config.yaml) is a basic configuration that stores logs in the local filesystem.
# loki-config.yaml

auth_enabled: false

server:
  http_listen_port: 3100

common:
  instance_addr: 127.0.0.1
  path_prefix: /tmp/loki
  storage:
    filesystem:
      chunks_directory: /tmp/loki/chunks
      rules_directory: /tmp/loki/rules
  replication_factor: 1
  ring:
    kvstore:
      store: inmemory

schema_config:
  configs:
    - from: 2023-12-24
      store: boltdb-shipper
      object_store: filesystem
      schema: v11
      index:
        prefix: index_
        period: 24h
The storage_config section determines the configuration for one of several available storage options for both the index and chunks. The specific configuration to be utilized is specified in the schema_config block. This block is responsible for configuring the schema of the chunk index and determining its storage location. The http_listen_port setting allows you to specify the port on which the HTTP server will be accessible and ready to accept logs (3100 is the default value, but we specify it for better visibility).
Loki is usually used with Grafana, a popular open-source analytics and monitoring platform. Grafana provides a powerful interface for visualizing log data stored in Loki. For Grafana we need to provide a Loki data source configuration file (grafana.yaml). In the url field we have to provide the address of the Loki instance. Our Loki host in docker-compose.yaml file would be named loki, so the address value is http://loki:3100.
# grafana.yaml

apiVersion: 1
datasources:
- name: Loki
  type: loki
  access: proxy
  orgId: 1
  url: http://loki:3100
  basicAuth: false
  isDefault: true
  version: 1
  editable: false
As we already have Loki and Grafana config files, we can put them into docker-compose.yaml file.
#docker-compose.yaml

version: "3"

networks:
  loki:

services:
  loki:
    image: grafana/loki:2.9.0
    ports:
      - "3100:3100"
    command: -config.file=/etc/loki/local-config.yaml
    networks:
      - loki

  grafana:
    image: grafana/grafana:10.1.1
    volumes:
      - ./grafana.yaml:/etc/grafana/provisioning/datasources/datasources.yaml
    environment:
      - GF_PATHS_PROVISIONING=/etc/grafana/provisioning
      - GF_AUTH_ANONYMOUS_ENABLED=true
      - GF_AUTH_ANONYMOUS_ORG_ROLE=Admin
    ports:
      - "3000:3000"
    networks:
      - loki
If we start our system by executing docker-compose up in a terminal, we should see an empty Grafana Loki page on http://localhost:3000/explore.

In the next step, we will add two simple Python applications to test whether our Loki instance can handle logs from different sources.
Pushing application logs to Grafana Loki
For applications, pushing logs to Grafana Loki involves integrating agents like Promtail within the application side. This seamless interaction enables the extraction and streaming of logs to the Loki instance.
For deploying Promtail alongside an application in a Docker Compose environment, a single Promtail instance is employed to scrape data through access to unix:///var/run/docker.sock. In scenarios where container orchestration tools such as Kubernetes are utilized, a more streamlined approach is possible. In such cases, leveraging a Helm chart becomes convenient as it facilitates the deployment of both the Promtail instance and the application generating logs cohesively.
We configured a simple promtail-config.yaml file to scrape logs from application containers.
# promtail-config.yaml

server:
  http_listen_port: 9080

positions:
  filename: /tmp/positions.yaml

clients:
  - url: http://loki:3100/loki/api/v1/push

scrape_configs:
  - job_name: containers
    docker_sd_configs:
      - host: unix:///var/run/docker.sock
        refresh_interval: 5s
        filters:
          - name: label
            values: ["logging=promtail"]
    relabel_configs:
      - source_labels: ['__meta_docker_container_name']
        regex: '/(.*)'
        target_label: 'container'
Client configuration url indicates the address (http://loki:3100/loki/api/v1/push) to which Promtail will push log entries. This points to the Loki server, which is responsible for storing and indexing log data. The scrape_configs section defines which logs will be scraped. Container selection for logging is based on specific criteria defined in filters subsection. In our case, we are looking for containers with logging=promtail label attached.
The Promtail config can be now added to docker-compose.yaml file. The /var/run/docker.sock:/var/run/docker.sock mapping in a Promtail Docker Compose configuration provides access to the Docker daemon socket within the Promtail container. This configuration is crucial when Promtail is deployed alongside Docker containers and needs to interact with the Docker API.
# docker-compose.yaml

version: "3"

services:
    image: grafana/promtail:2.9.0
    volumes:
      - /var/lib/docker/containers:/var/lib/docker/containers:ro
      - /var/run/docker.sock:/var/run/docker.sock
      - ./promtail-config.yaml:/etc/promtail/config.yml
    command: -config.file=/etc/promtail/config.yml
    networks:
      - loki
To illustrate how to scrape logs from applications, we create two simple Python applications, each with a single HTTP endpoint that registers info logs.
- reservations service
import logging

from flask import Flask

app = Flask(__name__)
logging.basicConfig(
    format='%(asctime)s: %(levelname)s: %(message)s',
    encoding='utf-8',
    level=logging.INFO,
)

@app.route("/reservations", methods=["GET"])
def reservations():
    logging.info("Reservations endpoint")
    return "ok"
- notifications service
import logging

from flask import Flask

app = Flask(__name__)
logging.basicConfig(
    format='%(asctime)s: %(levelname)s: %(message)s',
    encoding='utf-8',
    level=logging.INFO,
)

@app.route("/notifications", methods=["GET"])
def notifications():
    logging.info("Notifications endpoint")
    return "ok"
The following Dockerfile is needed to build containers for these applications (in requirements.txt we have only flask dependency).
# Dockerfile

FROM python:3.9-slim
RUN apt-get update && apt-get install build-essential -y
COPY app.py requirements.txt /
RUN pip install -r requirements.txt
EXPOSE 8081
CMD ["flask", "run", "-h", "0.0.0.0", "-p", "8081"]
As we have reservations-service:v0 and notifications-service:v0 built (using docker build -t command), we can add them to the existing docker-compose.yaml configuration. The logging=promatail label is added to both services to make them scrapable by our Promtail instance.
# docker-compose.yaml

version: "3"

services:
  reservations-service:
    image: reservations-service:v0
    labels:
      logging: "promtail"
    ports:
      - "8081:8081"

  notifications-service:
    image: notifications-service:v0
    labels:
      logging: "promtail"
    ports:
      - "8082:8081"
If we restart our Docker Compose services, we should have both Grafana Loki and Python applications running. By hitting http://localhost:8082/notifications and http://localhost:8081/reservationslogs can be registered.

By visiting http:/localhost:3000/explore Grafana Loki view, we can see aggregated logs from notifications-service and reservations-service.
Grafana Loki uses a query language that allows users to search and filter logs efficiently. The query language is inspired by Prometheus and provides a powerful and flexible way to retrieve specific log entries based on various criteria.
Conclusion
Centralized logging with Grafana Loki offers a robust solution for managing and analyzing logs in a modern application environment. Keeping logs from several sources in a single place can give you a straightforward tool for tackling complex problems in your system.
The code that was used in this post, can be found here in the full version.


